If you want to notice patterns in how you feel — not just vague impressions, but an actual trend line — a spreadsheet beats a paper journal. Excel can log your daily mood in seconds and redraw a chart automatically every time you add a new entry, so you always have an up-to-date picture without touching the chart itself.
Table of Contents
Below is the layout we use in the free printable linked near the top of this post, plus the exact steps to recreate the auto-updating chart, color-coded ratings, and dropdown entry in Excel if you want to build a digital version yourself.
Download the Free Daily Mood Tracker Log
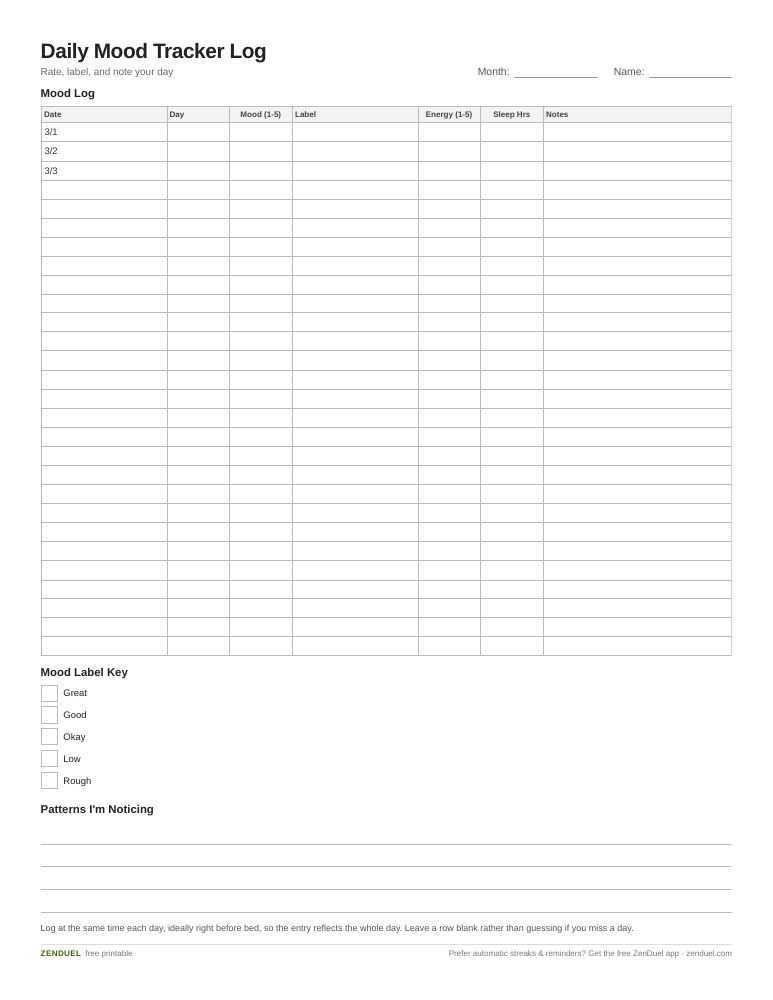
Our own template — free, no sign-up, no email required. A 28-day mood log with day, rating, label, energy, sleep, and notes columns, plus a label key and a notes section for spotting patterns. US Letter (prints fine on A4). For Google Sheets, upload the .xlsx via File → Import.
Daily Mood Tracker Log (Excel / Google Sheets) Daily Mood Tracker Log (PDF)
Quick Answer
Log each day’s mood as a number (1-5) in an Excel Table, add a color-coded dropdown for fast entry, then insert a Line chart pointed at that table — because it’s a Table, the chart automatically redraws itself every time you add a new row.
The Template Layout
The attached file has two tabs. The ‘Mood Log’ tab is where you enter data daily, with one row per day and these columns: Date, Day of Week (auto-filled with a formula), Mood Rating (1-5), Mood Label (a dropdown: Great, Good, Okay, Low, Rough), Energy Level (1-5, optional), Sleep Hours (optional), and Notes (free text for what influenced the day). The rows are already formatted as an Excel Table, so the sheet is ready for a full year without any setup.
The ‘Dashboard’ tab holds the automatic charts: a line chart of Mood Rating over time, a small column chart showing how many days fell into each mood label, and two summary cells showing your average mood for the current month and the prior month using AVERAGEIFS formulas. Everything on this tab pulls from the Table on the Log tab, so it updates the moment you log a new day — you never touch the charts directly.
Building It Yourself (If You Want a Custom Version)
Start by selecting your data range and converting it to a Table (Ctrl+T, or Insert > Table). This is the step most tutorials skip, but it’s what makes the chart ‘automatic’ — a chart built on a Table range expands on its own as you add rows, while a chart built on a fixed cell range does not.
For the mood dropdown, select the Mood Label column, go to the Data tab, click Data Validation, set ‘Allow’ to List, and type your labels separated by commas (e.g., Great,Good,Okay,Low,Rough). This keeps entries consistent so your charts and formulas can count them reliably.
To color-code moods as you type, select the Mood Label column, go to Home > Conditional Formatting > New Rule, choose ‘Use a formula to determine which cells to format,’ and write one rule per label (for example =$D2=”Great” with a green fill, =$D2=”Rough” with a red fill). Repeat with a different color for each label.
Finally, select the Date and Mood Rating columns, go to Insert > Chart, and choose a Line chart. Because the source is a Table, every new row you log will extend the line automatically — no re-selecting the data range, ever.
Tips / Common Mistakes
Keep the rating scale simple and consistent — a 1-5 scale is easier to stick with daily than a 1-10 scale, and consistency matters more than precision for spotting trends. Log at the same time each day (many people find right before bed works well) so entries reflect the whole day rather than whatever mood you’re in at the moment of writing.
Don’t skip the Notes column. A mood number tells you what happened; a short note (‘bad sleep,’ ‘deadline,’ ‘walked outside’) tells you why, which is what actually helps you spot patterns over weeks. If you miss a day, leave the row blank rather than guessing — a gap is more honest than a fabricated entry and won’t distort your average.
If the chart stops updating, it’s almost always because new rows were typed below the Table’s border instead of inside it. Typing directly into the row right after the last Table row will auto-extend the Table (and the chart) — pasting data in an oddly shaped block sometimes won’t, so check Table Design > Resize Table if that happens.
Explore more: more mental health tools and trackers.
Excel Mood Tracker Template FAQs
Do I need any Excel experience to use this template?
No. Open the file, type a date and pick a mood from the dropdown, and the chart updates itself. You only need the formula/conditional-formatting steps above if you’re customizing the layout.
Can I use this mood tracker in Google Sheets instead of Excel?
Yes, the .xlsx version opens directly in Google Sheets. Google Sheets now imports Excel tables as native Sheets tables, so the Mood Log’s table structure, dropdown, and conditional-formatting colors carry over intact instead of flattening into a plain range. Charts built on that table come across the same way and keep updating as you log new rows.
What mood scale should I use, numbers or words?
Use both: a number (1-5) for charting and math, paired with a short label (Great, Good, Okay, Low, Rough) for quick visual scanning and conditional-formatting colors. Numbers alone are hard to interpret at a glance; words alone are hard to chart.
How far back should the chart show data?
For daily tracking, a rolling 30-90 days is usually the most readable view — long enough to see a trend, short enough that the line isn’t crowded. You can filter the Table by date or add a second chart for the full year if you want both views.
Skip the Spreadsheet — Track It in ZenDuel
Habit streaks, mood tracking, and accountability duels in one free app — no template maintenance required. Get ZenDuel.
Want a calmer inbox? Subscribe to the free newsletter.
Photo by Eco Warrior Princess on Unsplash.